Team

  • Mirai Shah
  • Richa Chaturvedi
  • Sam Plank

Goal

To ensure that listings are fairly priced for both the hosts and the visitors. We hope to do this by the increasing transparency of the process to discover which features of a listing are most correlated with price. A recent study at the Harvard Business School revealed that non-black New York Airbnb hosts charge on average 12% more than black hosts for equivalent rentals. We aim to standardize pricing by creating an honest model that prices listings based off of important real estate features.

Data

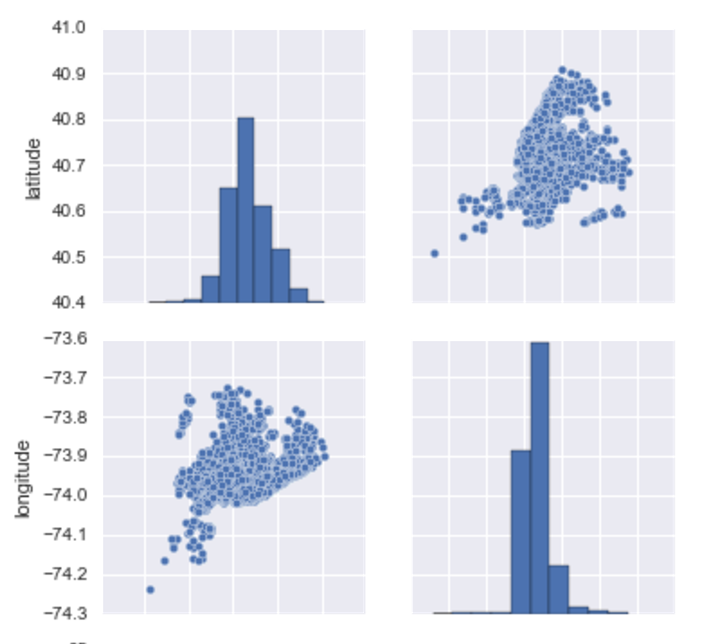
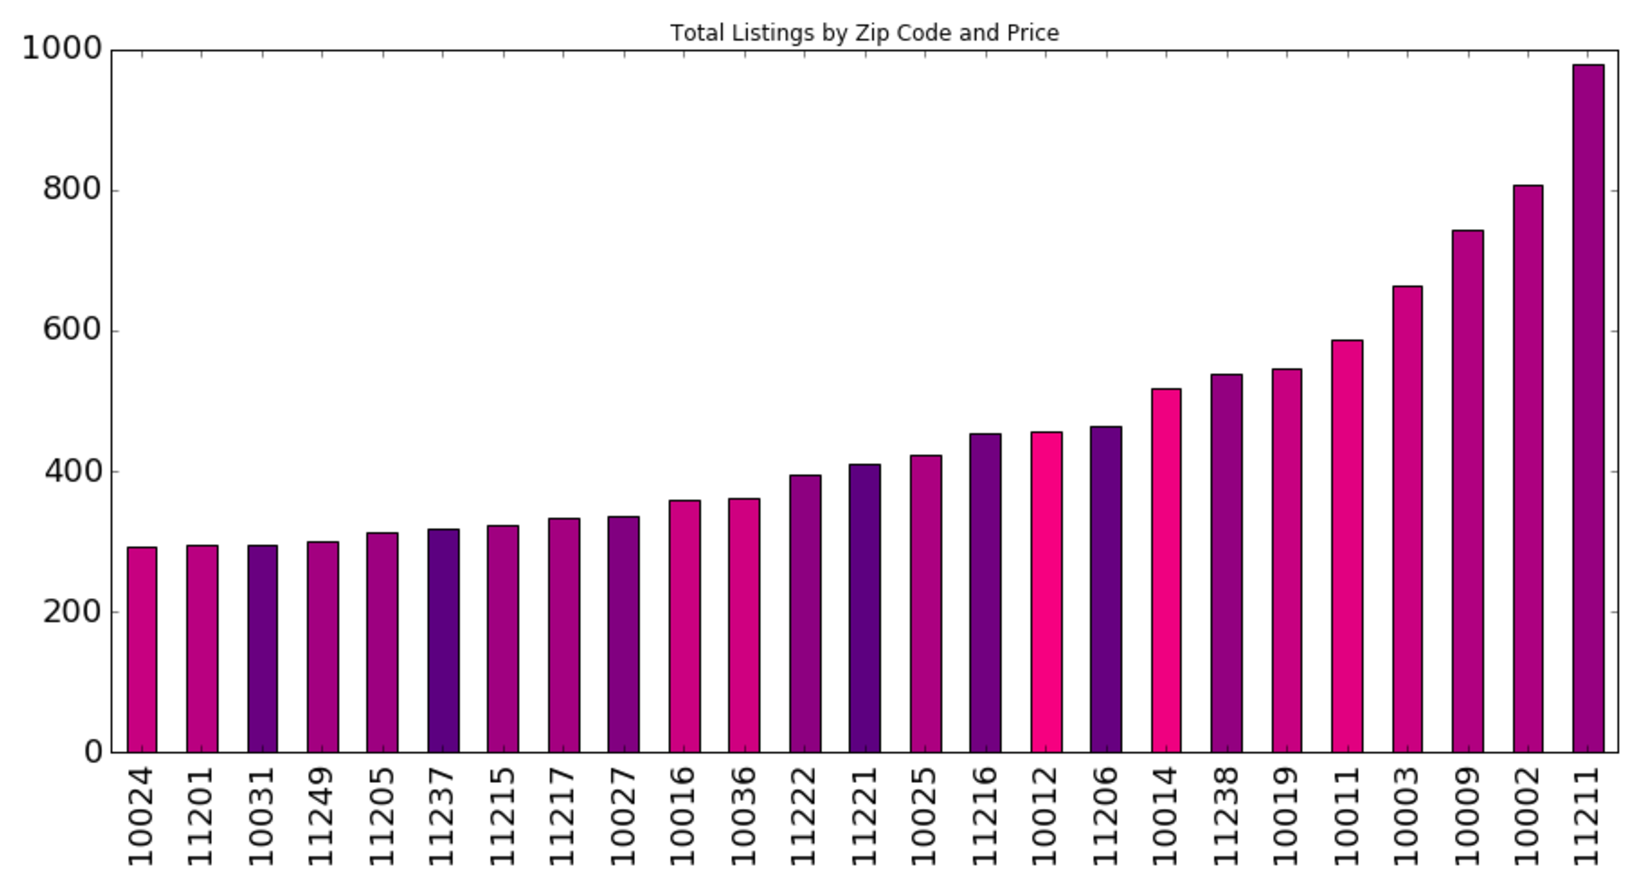
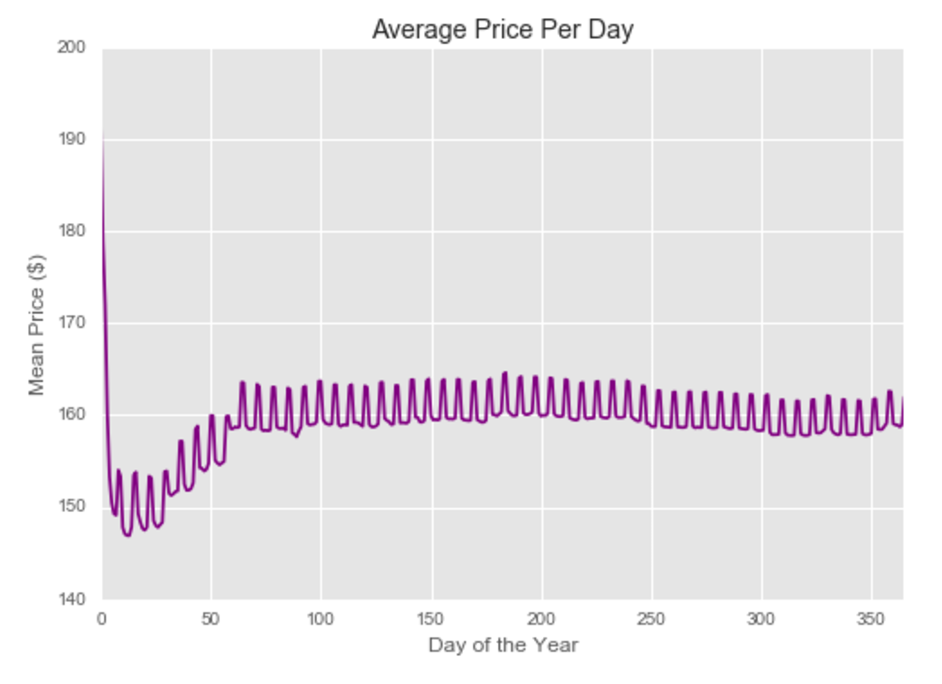
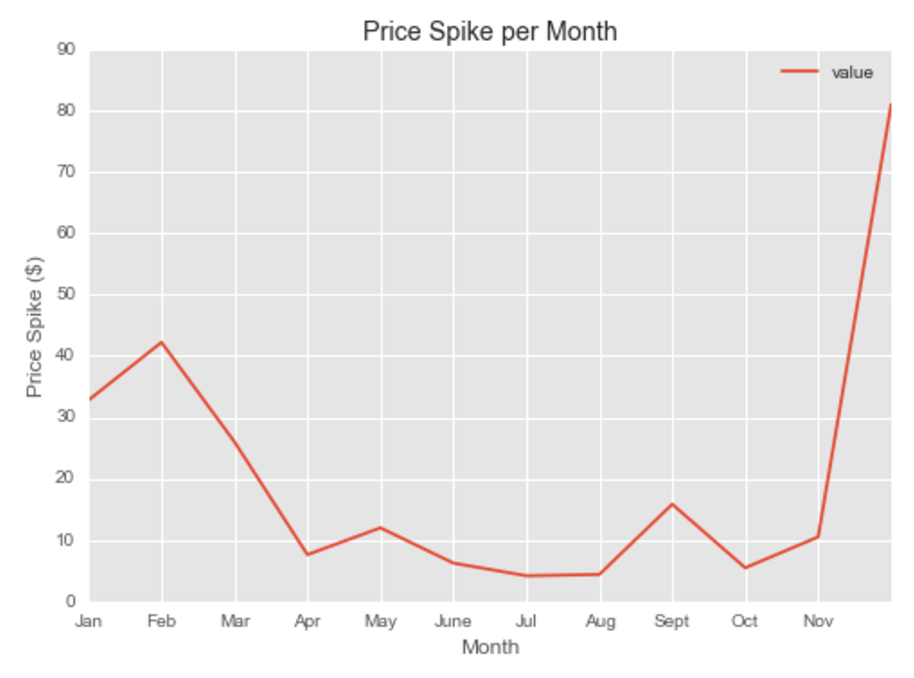
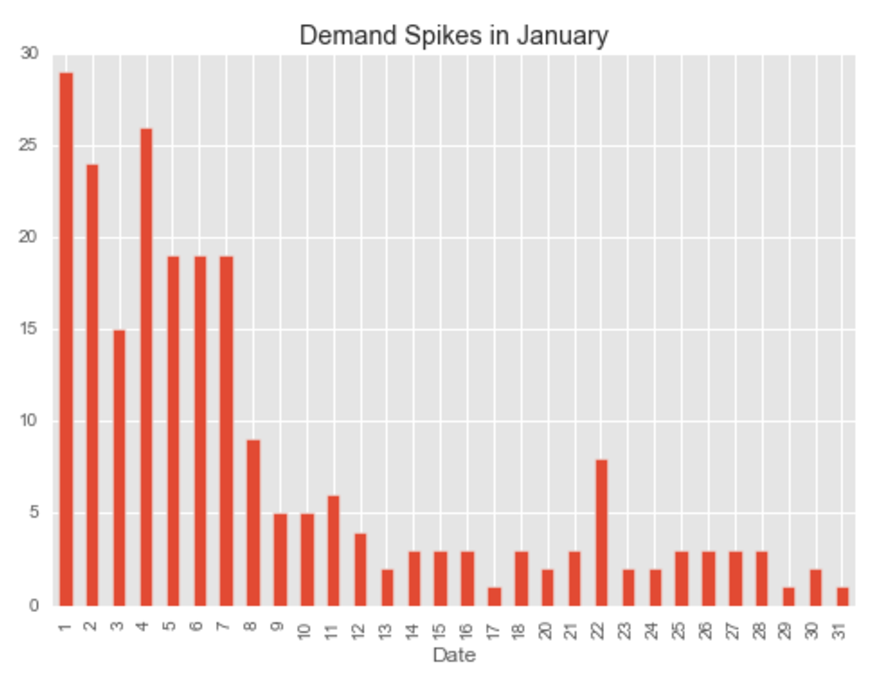
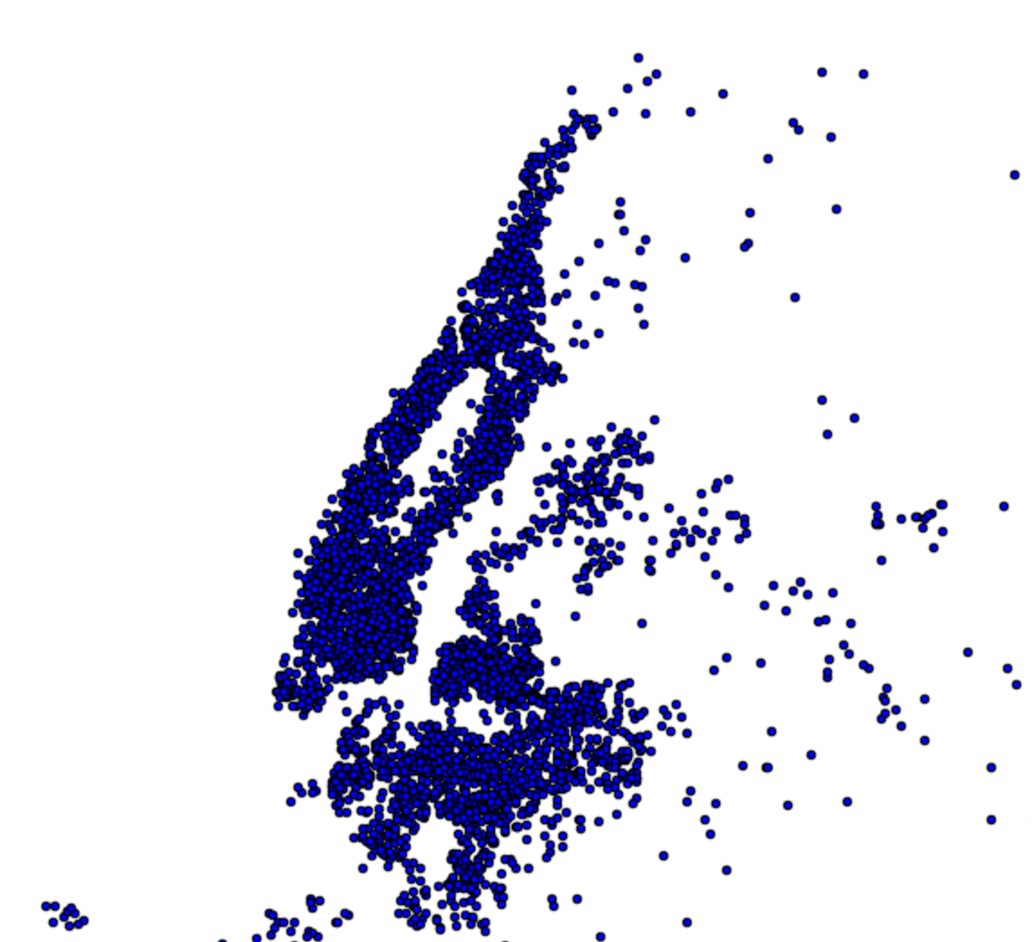
Our primary dataset for this project came from data.BetaNYC, an open source website aimed at improving New York City through civic technology and government transparency. Our dataset contains thousands of New York Airbnb listings and accompanying information about location, amenities, and price. Our secondary dataset contains the prices of listings every day of the year. We show initial observations of the dataset here.

Data Exploration and Cleaning

The data exploration and cleaning process was iterative and evolved as we worked more with the dataset. At first we attempted using KNN to fill in missing data, but it was not effective because every row had missing values so it was difficult to compare similar listings. We instead manually searched through the data, extrapolating some information and and dropping values that were not salvageable. Throughout this process, we looked closely at how the variables were related, and how price changed over the course of a year in order to create the best model we could. Some of our data explorations can be seen here.

  • Clustering
  • Matrix of Variables

Clustering and Variable Comparison

We first attempted to look for natural clusters in the data to see if any could be identified. We could not ascertain any significant clusters and therefore decided not to move forward with incorporating clustering into our final model. In order to compare the relationships between variables, we plotted them against one another in matrix form, which can be seen above. As you can see, the relationships between variables are not strictly linear.

Price and Neighborhoods

We examined the most popular neighborhoods and zip codes to see how popularity and price interact. In the plots above, we colored the bars by price, with redder prices being more expensive. It is evident that there is no clear relationship between price and popularity. For example, in Neighborhood Popularity and Price, Williamsburg is the area with the most listings but not a very red bar, which indicates low listing prices. The neighborhoods that were most expensive made sense with our pre-existing knowledge about New York: places like Chelsea and the East Village, which we know to be expensive, returned the reddest bars. In Zip Code Popularity and Price, a zip code in Williamsburg was again the most popular.

Price and Date

Next, we looked into the relationship between price and day of the year. The graphs above reflect two different types of price spikes for listings: those during weekends and more significant ones during holidays. After seeing that date seemed to affect price, we incorporated indicator variables into our dataset to reflect whether or not the price went up on holidays and weekends for each listing.

Important Prices in Months

We then zoomed in on three months in which we know that holidays cause price spikes: January (New Year's Day), July (Independence Day), and December (New Year's Eve). The graphs above show that the prices of listings spike drastically around January 1, July 4, and December 31, thus reiterating the importance of incorporating holiday prices into our model.

Proximity to attractions

After confirming that location is very important in determining price, we decided to incorporate more location variables into our dataset. We scraped the top attractions in NYC and created a variable that counted how many of them were within walking distance from each listing. Attraction Location plots the attractions on a map of greater New York. Distance from Listing shows the distances from a specific listing to each attraction. A radius surrounds the listing to demonstrate how many attractions would be considered within range.

Modeling

We tested many different models before settling on our final pick. Our findings revealed that linear models (Multivariate Linear, Ridge, and LASSO) did not perform as well as ensemble methods. This intuitively made sense because there did not seem to be any linear relationships between the predictors and the target variable. Moving forward with ensemble methods, we found that after feature reduction and tuning, Gradient Boosting yielded the the consistently highest scores in price prediction. We therefore selected Gradient Boosting as our final model.

Models

We began modeling by running a baseline comparison between both linear and ensemble methods. We found that besides Lasso, the models performed similarly. Gradient Boosting had the slight edge.

Optimizing Models

In order to ensure our model was performing optimally, we performed feature reduction and tuned a number of parameters. For Gradient Boosting, this included testing different max depths, numbers of features, and learning rates to see which performed best without overfitting the data. After selecting the optimal parameters and reducing the dataset, we ran our final model.

Variable Importance

After running our model, we wanted to visualize which variables were the most important to the model. The results confirmed our suspicions: in real estate, nothing is more important than location, location, location. Longitude and Latitude ranked as the top 3 most important variables, with our sentiment variable making the top 10. This encouraged us and affirmed that we had correctly applied sentiment analysis to the reviews dataset. None of the variables that made this list surprised us, which was a good sign because we know that as data scientists, it's important to check our results off of our intuition and common knowledge.

Conclusion

Our findings show that location is the most important feature when determining a price for an Airbnb listing in New York City. When we started this project, we hoped to increase the transparency of the pricing process by understanding which features were most correlated price. Using Gradient Boosting, we were able to predict Airbnb prices with a high accuracy. Moving forward, we hope to look more into race of the hosts to see if race affects price of a listing. We hope to continue to work towards transparency in the Airbnb pricing process for both hosts and customers.